
Please see updated and expanded research on this page tinyurl.com/ccgwbook
Why it is NOT being caused by increased CO2 emissions from human activity.
By
Andrew Johnson
29th Dec 2010
This is a revised version of a submission to the Solar Radiation Management Governance Initiative (www.srmgi.org)

1.3 Catastrophism – Divide and Conquer?
1.4 Attitudes to Those Challenging Some of the Science
1.5 Distinguishing between “Environmental Damage” and “Climate Change”
1.6 Difference Between Modelling and Observation
2. PERSISTENT JET TRAILS/CHEMTRAILS
2.1 Widespread Concern about Aircraft Trails
2.2 Belfort Group’s Report on Aircraft Contrails (“Case Orange”)
2.3 Persistent and Non-Persistent Trails
2.4 New Documentary Presents Evidence of Ongoing of Geoengineering
2.5 Aircraft Identification and Tracking
2.7 Easyjet “Trail and No Trail”
2.8 Photos of Trails Left by These 2 Aircraft
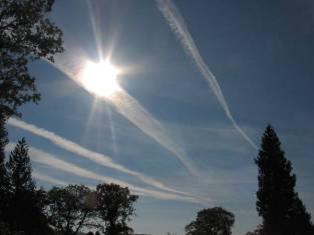
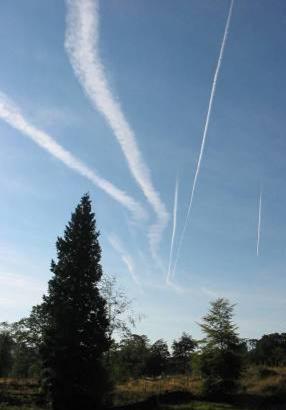
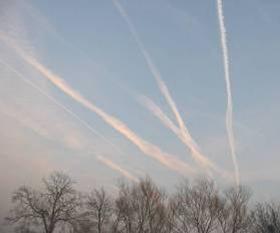
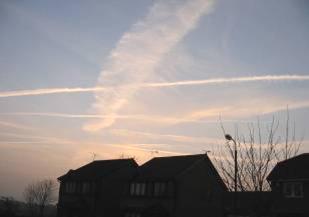
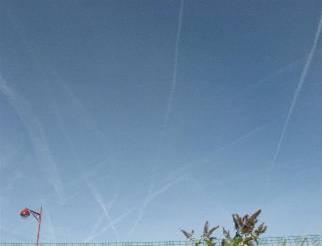
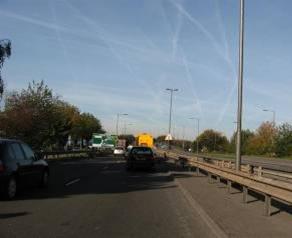
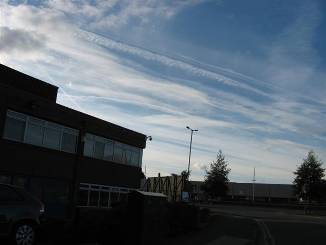
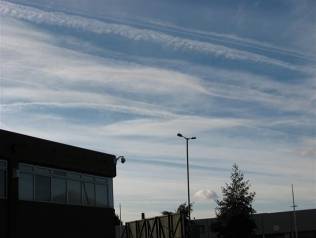
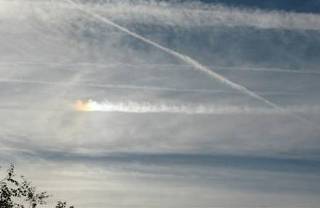
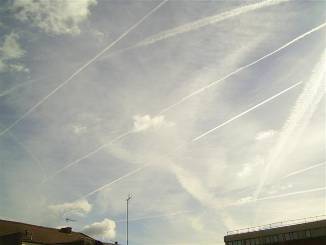
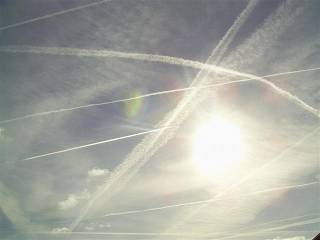
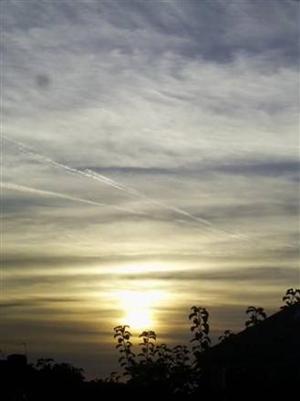
2.9 Other Jet Trail Photographs from Around the UK
2.11 Case Study – Derby – 04 Feb 2007
2.12 Case Study – Many Trails seen around the UK, and from Space – 18th Oct 2007
3.2 Venus – Changes in Composition of Atmosphere
3.3 Mars – Polar Ice and Hexagon Shape?
3.4 Saturn: “Saturn’s rotation puts astronomers in a spin”
3.6 Neptune – “Seasonal Changes”?
3.7 Pluto: Pluto is undergoing global warming, researchers find
3.8 Possible Mechanism Behind these Changes?
4. SOLAR ACTIVITY AND CLIMATE AND THE MWP
4.2 The Medieval Warming Period (MWP)
5. WEATHER ANOMALIES – GEOENGINEERING ALREADY IN USE
5.2 Weather Anomaly Photos from the Ground (Many more available)
5.4 The HAARP project and Ionospheric Heaters
6. A PARTIAL ANSWER TO ENVIRONMENTAL POLLUTION AND DESTRUCTION?
6.1 Investment in Energy Alternatives
6.2 Cold Fusion – killed off by Vested Energy Interests
6.3 Salter’s Duck – killed off in the 1980’s
6.4 Meyer Cell – Efficient Water Splitter – Emission-less Car
6.5 Safe Hydride Storage System for Hydrogen Car – Illegal
7. HOW SOUND IS THE BASIS FOR AGW CONCLUSIONS?
7.2 “Climategate” (Hadley CRU) – Admitted Science Fraud
7.3 Many Scientists Do Not Agree with AGW Theory
1.1 Rationale
This document attempts to collect together a range of diverse data which proves that the whole issue of “climate change” is more complicated and challenging than almost all researchers into all these topics are willing to consider, examine or entertain. If you have an open mind, you should find much of interest to follow up here. If you have a closed mind, then you will probably not get much of value out of this document.
1.2 Setting Public Policy
For much of the last 20 years, the debate about what is most affecting our climate has been raging. More recently, it seems, certain groups within mainstream science and academia have gained “the upper hand” and the wider population appear to have accepted their (flawed) conclusions. These conclusions have then been used to set public policy in governments around the world. This has happened despite the repeated reports of a failure to agree various “environmental targets” at a number of “climate summits” that have taken place over the last few years (Kyoto[1], Copenhagen[2] and so on). A troubling development in the last few years has been open discussion of Geoengineering – modifying the earth’s climate directly – by one means or another[3],[4].
1.3 Catastrophism – “Divide and Conquer” and “The Control Group”
It seems to be true that if you tell people their way of life is under threat – and you present them with some vaguely plausible story as to how you know this is true – they will become easier to manipulate. They may question you about your conclusions and, if you can answer their questions in a credible way, you will gain their confidence and, as a consequence, gain power over them.
However, it seems that to really understand what is happening, one has to entertain that there is, indeed, an overall “control group” which has an agenda. That agenda is one of gaining increased power and control over the lives of “ordinary people”. With research and campaign groups polarised, it becomes much easier to hide the control group’s identity and even hide the very idea of the control group’s existence! The task of concealment is therefore assisted by a process of creating “factions” within the general populace who “sit” on either side of an issue and expend their energies “arguing” and even attacking each other. Whilst attention is focused on the squabbles, the control group can carry out its agenda – whilst most people are blind to the evidence which betrays the control group’s reality. (The clearest evidence of the reality of some kind of powerful control group – of unknown identity – is shown in the data from section 5 and likely some of the effects observed in the data in section 2 are a result of this control group’s activities.)
Most people are also blind to the operation of the control group’s tactics to hide their own existence and identity and the control group’s ability to confuse or confound anyone trying to uncover more information about the control group. Some people become “seduced” by the wish for more power and influence and then, perhaps, are unwittingly co-opted into the larger agenda. Some people feel (for reasons discussed in section 1.5) they are helping the earth / planet / environment or they are helping to create a “positive future”.
1.4 Attitudes to Those Challenging Some of the Science
Typically, when data like that shown later in this document, is/are brought up or discussed, there is a huge adverse reaction to it and a “big fight” then ensues. Here is a typical example of this – in a TV interview with Ed Begley and Stuart Varney of Fox News, where Varney asks if the Science about climate change is conclusive and challenges various statements made by Begley, Begley states "You’re spewing your nonsense again …"[5] I wonder if some of this reaction stems from what is discussed in section 1.5.
Similarly, famous people – who are not scientists – have made widely read comments which do not address any of the data which is included later in this document – e.g. “[Paul] McCartney, in Interview, Compares Global Warming Skeptics to Holocaust Deniers”[6]. For those who are naturally skeptical, sniggers or cries of phrases such as “Conspiracy Theory” or “Tin Foil Hat” often serve to discourage renewed, reasoned and dispassionate analysis of evidence. (This, it seems, is an example of how group mentality can be influenced and moulded.)
It should be borne in mind that finding the truth demands a most vigorous application of energy and time to investigate what is truly happening – and this investigation must take place with a clear and stated independence from corporate and other vested interests – and without recourse to either invective or preconceived notions.
1.5 Distinguishing between “Environmental Damage” and “Climate Change”
There is no doubt that human activity is damaging the environment. For example, industrial pollution and “industrialized” fishing and agricultural practices have, it is clear, destroyed habitat and caused the extinction of a number of species of flora and fauna – in various ways, and for various reasons. With the real damage caused on a daily (and large scale) basis, it is easy to manipulate people’s emotions, fears and “environmental conscience” when presenting these matters (without proper distinction between “Environmental Damage” and “Climate Change”).
Most people have at least some awareness of the effects of their lifestyle on the environment, though these effects are often hidden – except when large numbers of people are affected by such things as dumping of industrial waste, depletion of fish stocks or intensive farming practices etc. Is it any wonder that some websites promote the AGW myth “out of love”[7]?
A distinction must also be made between local and global climate changes. For example, the Urban Heat Island Effect[8] is well understood and the data is/are clear. The same conclusions (by definition), cannot apply on a global scale, however i.e. an “island” is not “a globe”.
Nowadays, when some people suggest that changes in the weather are not caused by industrial pollution, it is assumed they are somehow suggesting we should not worry about wholesale pollution of the environment. Or it is tacitly assumed that those suggesting other causes for changes in climate are saying that “humanity should not worry about the effects of their activities on the environment”. So, because of the increase in visibility of environmental organizations and issues in the last 30-40 years, it becomes easier to marginalize the legitimate scientific questions raised by people who remain unconvinced that Carbon Dioxide emissions (specifically) from human industrial activity have had any provable effect on global climate in the last 150 years.
There is no doubt that CO2 output has increased due to industrialization, but later in this document, much data which needs to be properly studied, proves the climate change issue is much more complicated than is generally spoken of – and extra CO2 from industrialisation is probably the least significant issue (and therefore the perfect disguise for any control group’s agenda).
1.6 Difference Between Modelling and Observation
Most of the theories about AGW (Anthropogenic Global Warming) involve some kind of modelling or projection – this is always a less reliable basis for a proposal than “observed data from recent history” (which is largely what this document contains). One question that can be raised, for example, is “How is the distinction made between the quantity of naturally produced CO2 and that produced by Industrial Processes?” My understanding is that such figures must be based on estimates – as it is impossible to accurately quantify these things on a global scale.)
1.7 A Warning from History
In the research I have done, it has become clear that corporate and even military interests in matters such as climate cannot be overlooked or ignored. For example, the climate is a matter of National Security. Therefore, perhaps readers should bear in mind President Eisenhower’s message, from his 1961 farewell address to America[9]:
"In the counsels of Government, we must guard against the acquisition of unwarranted influence, whether sought or unsought, by the Military Industrial Complex. The potential for the disastrous rise of misplaced power exists, and will persist. We must never let the weight of this combination endanger our liberties or democratic processes. We should take nothing for granted. Only an alert and knowledgeable citizenry can compel the proper meshing of the huge industrial and military machinery of defense with our peaceful methods and goals so that security and liberty may prosper together."
In this same speech, in relation to scientific research, he also said:
…the free university, historically the fountainhead of free ideas and scientific discovery, has experienced a revolution in the conduct of research. Partly because of the huge costs involved, a government contract becomes virtually a substitute for intellectual curiosity. For every old blackboard there are now hundreds of new electronic computers. The prospect of domination of the nation’s scholars by Federal employment, project allocations, and the power of money is ever present – and is gravely to be regarded. Yet, in holding scientific research and discovery in respect, as we should, we must also be alert to the equal and opposite danger that public policy could itself become the captive of a scientific-technological elite.
2.1 Widespread Concern about Aircraft Trails
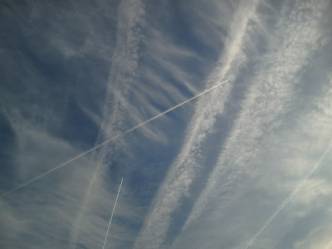
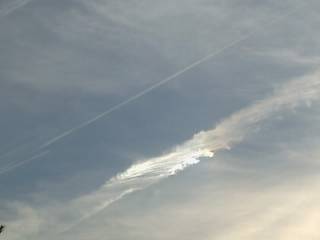
I have written about this issue on my website[10] and, I have had literally hundreds of pictures of persistent jet trails (along with some videos) sent to me by dozens of concerned people around the world. Dubbed “chemtrails” by some people, no one will explain them – nor the regularly observed weather changes they appear to cause on a number of days. All official sources state their formation is explainable as “contrails” – yet there is no consistent scientific explanation available which covers all the observed anomalies – such as grids, circles, 2 identical aircraft on the same day within 1 hour of each other with one leaving a long persistent trail and the other not (see section 2.7). Other data I have collected suggests that the reasons the trails persist, in some cases, cannot be explained by “the prevailing conditions”. Please review the pictorial data and use your own observations – or online sources to augment this data set.
2.1.1 Normal Reaction to these observations
Statements such as “this cannot be happening because there is no clear motive and no admission by any identified agency that this is going on” are common. This automatic reaction needs to “be put on one side” whilst repeated observation is undertaken – only then can such questions can be addressed.
2.2 Belfort Group’s Report on Aircraft Contrails (“Case Orange”)
A report was commissioned by a group of independent researchers into the phenomenon of persistent Jet Trails – a copy of the report is available on their website[11]. The report states in section “4.2.1. Variations in the daily temperature range as a result of contrails”:
Although it is clear that aircraft emissions have an impact on climate it is quite difficult to measure this, because aviation is just part of everyday life. However there has been one small window of opportunity to perform a reliable scientific survey, at the time that all commercial flights within the U.S. airspace were grounded for a period of 3 days after the events of 11 September 2001.
This survey, performed by David J. Travis, Andrew M. Carlton and Ryan G. Lauritsen, released in final form 2 years later (!), revealed a departure of average diurnal temperature range (DTR) from the normal values derived from the 1971 – 2000 climatology data for the indicated 3-day period in 2001. DTR values for 11 to 14 September during the grounding period, measured at stations across the United States, show an increase of about 1,1 °C in comparison with the normal values.
This increase is larger than any during the 11-14 September period for the previous 30 years, giving ammunition to critics who state that weather conditions at this specific period were very extraordinary and no scientific based conclusions could be taken. However even more surprising is the fact that the 11-14 September increase in DTR was more than twice the national average for regions of the United States where contrail coverage has previously been reported to be most abundant, such as the Midwest, Northeast and Northwest regions.
In the subsequent days after September 14th when civil flight operations resumed there was a temperature drop of about 0,8°C, denoting the return to ‘normal’ conditions. This underlines the impact of contrails on global surface temperatures with a noteworthy cooling down effect, especially reducing the maximum day temperatures. A new proof that aviation significantly affects climate emerged after the massive grounding in Europe in 2010 due to the volcano eruption in Iceland. It is too early to assess the quality of the survey, but the Kings College in London claims that ‘airports are air polluters’.
2.3 Persistent and Non-Persistent Trails
It is emphasized that the general properties of contrails are known and recognized by people who have submitted these photos to me. The difference between these types of trails is shown in videos referenced in section 2.10. A difference is also shown in the right hand photo in section 2.8. Also, please review and study the satellite photos especially.
2.4 New Documentary Presents Evidence of Ongoing of Geoengineering
A new documentary film has just been released called “What in the World Are They Spraying” where statements by some of the scientists involved with developing geoengineering proposals are documented and challenged[12]. The film also shows some of the data which some people have gathered in relation to aircraft trails and their apparent effects at ground level (which are denied by most scientists). The observed effects seem to match those discussed in some of the geoengineering proposals themselves, even though no large geoengineering projects are said to be in operation. In the film, one scientist is interviewed who explains how the pH of the soil in the area where he lives has increased from being alkaline to being neutral over the last few years – and this has affected the growth of vegetation. Other laboratory tests on snow from Mount Shasta in Northern California are also mentioned. These tests have shown anomalous high levels of strontium and aluminium – both substances which are referenced in some geoengineering/solar radiation management (SRM) research proposals.
The signatories to this report are extremely concerned by the issues covered in this film – and also feel the need for much more investigation to be done.
2.5 Aircraft Identification and Tracking
At some expense, I purchased an AirNav Radar Box to enable further quantification and identification of Air Traffic, in relation to studying trail persistence/non-persistence.
2.5.1 Airnav Box
The Airnav Radar Box essentially acts as a “radio message decoder”, primarily for ADS-B messages which are transmitted by both civilian and military aircraft. It is an “off the shelf” product, readily available, which plugs into a USB port and can decode the messages it receives, producing a “Virtual Radar” display which mimics those used in Air Traffic Control.
2.5.2 Antenna/Aerial
The aerial was positioned in the loft / attic of my house. Though this arrangement did not give the maximum detection range (an aerial positioned as high as possible, outside the house obviously gives the best detection range), it was more than suitable for this project, which was concerned with photographing aircraft as they travelled over the house – a range of about 20 miles was adequate.
2.5.3 Airnav Software
As mentioned above, the Airnav Software attempts to simulate an Air Traffic Controller’s display, displaying flight information, altitude, track etc. Additionally, all ADS-B messages decoded by the box are recorded/written to file and this can later be “played back”.
2.6 Air Traffic Survey/Study
Due to my concern over this issue, I have undertaken a study of Air Traffic over my house and have so far found that only about 20% of flights detected by AirNav broadcast their position – this study is not yet complete, but has so far shown that there is no relation to detected volume of air traffic and number of persistent trails seen (i.e some people assume that more visible trails means there is more air traffic at that time – the data collected so far do not support this assumption).
My study has employed custom software written to analyse and tabulate the large quantity of data generated and this will be published separately at a later date. One specific anomaly so far detected is documented in the next section.
2.7 Easyjet “Long Trail and Short Trail”
This incident took place on the date shown and indicated an unexplained difference in the trail caused by 2 identical planes, as shown below. Easyjet, when consulted, refused to offer an explanation for this difference[13].
Date: 05 March 2010
|
Time |
Flight |
Reg. |
Route |
Min Ht |
Max Ht |
Aircraft Type |
Ground Speed |
|
16:32 |
EZY067 |
G-EZIR |
Luton – Glasgow |
32525 |
33675 |
A319-111 |
380-390 |
|
17:24 |
EZY239 |
G-EZIN |
Stansted – Edinburgh |
32900 |
33000 |
A319-111 |
384 |
2.7.1 Photographs of EZY067
 These photographs were taken with an Canon SX20-IS which is a 12 Megapixel unit and has a 20x optical zoom. The lens system employs an optical image stabiliser. (Approx 1 minute difference between camera time setting and PC time setting).
16:32 – EZY067
(Photo taken facing roughly west).
2.7.2 Airnav Radar Box Track – EZY067

2.7.3 Photographs of EZY 239
17:24 – EZY 239

(Photo taken facing roughly east north east).
2.7.4 Airnav Radar Box Track – EZY 239

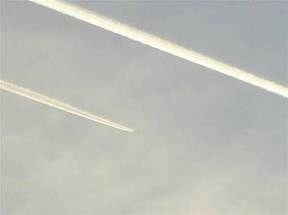
2.8 Photos of Trails Left by These 2 Aircraft
|
|
|
||
|
16:32 – EZY067 – Long Trail |
17:24 – EZY 239 – Short Trail (why does only one trail persist?) |


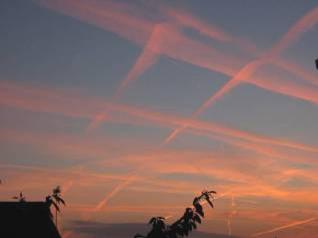
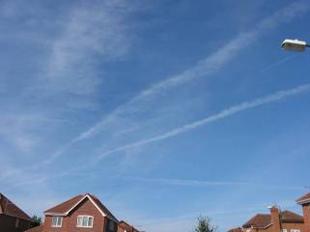
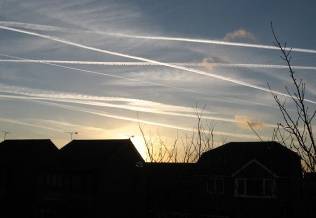
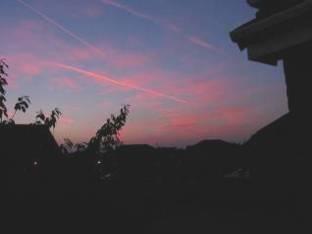
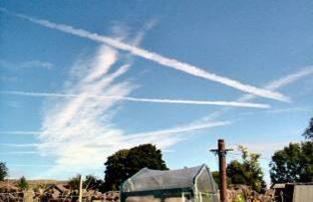
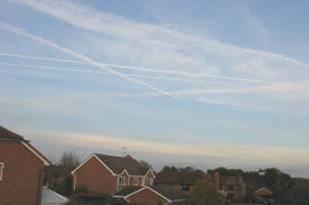
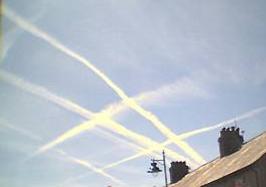
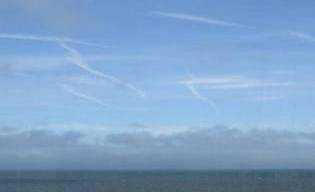
2.9 Other Jet Trail Photographs from Around the UK
|
7th April 2003, 18-17, Borrowash |
10th June 2005, 21-45, Borrowash |
|
21st August 2005, 16-13 Borrowash |
Borrowash, Feb 21, 2009
|
|
3rd Sept 2005, 10-36 Borrowash |
12th Sept 2005, 10-21, Lake District |
|
12th Sept 2005, 09-31, Lake District |
24th Jan 2006, 17-20, Borrowash
24th Jan 2006, 17-20, Borrowash |
|
8th August, 2005, 13-04 Embsay, Yorkshire |
29th Oct 2006, 17-09 Borrowash |
|
Morecambe, May 2007 (Cell phone Camera) |
Bognor Regis, May 07, 2007, 18-04 |
2.10 Video of Trails
There are many online videos, some including time-lapse photography, for example. A video by Idaho weatherman Scott Stevens shows a comparison between contrails and Chemtrails[14].
Additional videos:
|
Cheshire (Posted July 2008) |
|
|
Norwich, May 2009 |
|
|
Farnham, Surrey June 2006 |
|
|
Near Toulouse, France June 11 2006 |
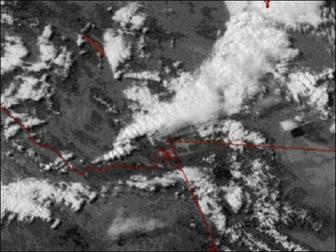
2.11 Case Study – Derby – 04 Feb 2007
On this particular day, I observed and filmed at least 42 different aircraft flying over Derby during an afternoon outing lasting about 2½ hours. The video can be viewed online too:. Satellite pictures of the UK taken on the same day (shown here rapidfire.sci.gsfc.n… ) clearly demonstrate the reality of the phenomenon, as seen from space.
|
West England, 4th Feb 2007[15] |
|
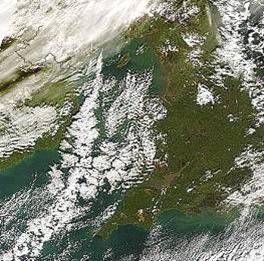
2.11.1 Note about Trail Length
 The photo above begs a simple question. How is it possible for trails to persist for so long that they form long lines? Look at the trail marked in a separate photo.
This trail is 172 pixels long – this means that at 2km per Pixel, the trail is about 364 km long. (A small adjustment may need to be made due to the distances above ground, if the ground resolution is 2km/pixel then at a height of 30,000 feet, the resolution would be maybe 1.9 km per pixel). If we assume it was made by an aircraft similar to a 757 or an Airbus A320, and we assume the plane was travelling at 500 mph for the time the trail was forming, this means that the trail persisted for at least:
364 / (500 * 8/5) = 0.455 hours = 27 minutes!
(and it could be longer, since the satellite photo may have been taken AFTER the trail had formed.)
2.12 Case Study – Many Trails seen around the UK, and from Space – 18th Oct 2007
All photos in this section were taken on 18th Oct 2007[16].
|
Derby |
M1 to Leeds |
|
Leeds |
|
|
Leeds |
M1 |
|
Hertfordshire |
Hertfordshire |
|
Hertfordshire |
Hertfordshire
|
|
Keighley |
Keighley |
 Leeds
Leeds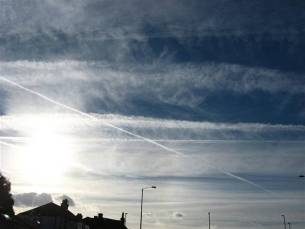
2.12.1 Shot of England from Space on 18 Oct 2007
Europe_2_01 – Date: 2007/291 – 10/18, True color – Satellite: Terra – Pixel size: 1km

Why are all the clouds in France in lines – like ripples on a pond? (Photo now archived and not easily accessible[17].)
2.13 Newspaper coverage (UK)
This section includes 2 instances of UK coverage in the local media.
2.13.1 Northwich Chronicle – (Phil Morris)
Man on the trail of skyscape mystery Aug 31 2005[18]
By Anthony Harvison, Northwich Chronicle
ARE the skies being illicitly contaminated with a mysterious substance that may have serious effects on people’s health?
One Cuddington man thinks so and is on a mission to find the truth.
Phil Morris, 50, is gravely concerned with what he perceives to be happening to the atmosphere in the North West and across the world.
The phenomena he refers to are known as ‘chemtrails’ – long-lasting, thick, white, expanding trails left by non-commercial planes, that eventually merge and blanket the skies.
‘Ask yourself this,’ he said, ‘when did you last see clear blue skies over Lancashire and Cheshire with no clouds anywhere – without the pure natural skyscape being polluted by these trails and haze?’
Phil first noticed the phenomena, contrasted with contrails (condensation trails) which are normal water vapour trails left by commercial airliners that usually disappear within a minute, three-and-a-half years ago.
He started videotaping them and has amassed a significant collection of images to support his arguments.
He continued: ‘The planes I have video-taped leave large crosses, grids, A and H shapes in the sky that spread out slowly over hours to create fake chemical clouds.
‘They fall and thicken quickly leaving the telltale doughnut on a rope shape, they are pure white in daylight, and pale pink as the sun sets, while every other natural cloud had varying shades of white, grey and black plus colours as the sun sets.
‘They also drift at around only 5%-10% the speed of normal clouds, often in the opposite direction to all the other clouds.
‘When the sky is full of haze left by trails it can get extremely humid, even when there is no visible sun, and air feels stale.’
‘I counted up to 50 planes last summer in one morning from sunrise to noon, and this happened on many occasions.’
Phil claims his health and his family’s have been affected in some way by the chemtrails, tallying with reports from around the globe. Symptoms include head pains, severe ear-ache, stiff neck and shoulders, dizziness, sinus infections, lack of concentration and all-year-round flu symptoms.
In Phil’s case, the symptoms got so bad that he went to hospital, fearing he had a brain tumour.
He said: ‘I had a brain scan at the Countess of Chester Hospital, but it showed no problems and the doctors said I was fine. The problem now is my eight-year-old son also has the same ‘brain ache’ on the day or day after our skies are clogged with this haze, but on no other days.
‘I met a woman from Delamere Park, less than one mile away, with exactly the same head pains.’
Official sources – including Defra (the Department for Environment, Food and Rural Affairs), the Ministry of Defence, the Met Office and NASA – have played down Phil’s concerns, stating the trails are nothing more than ice particles from water vapour at altitudes of 20,000-35,000ft.
‘But they are patently not,’ said Phil, ‘as these trails often go right through and below much lower, wispy, normal clouds at 5,000-10,000ft only.’
So what could be the explanation?
There are hundreds of websites with photos from the US and Europe of chemtrails, with guesses, based on rainwater and soil samples, at the material being sprayed.
‘Many websites in the US are convinced that US Air Force planes are spraying aluminium powder in a fibrous, expanding, spider-like mesh based on the thesis of H-Bomb inventor Ed Teller to trap Co2, deflect the sun’s rays and reduce global warming, and barium for 3D topography radar imaging purposes for the military,’ said Phil.
He admits there are lot of ‘weird and wacky’ conspiracy theorists out there but with the BBC and Guardian newspaper interested in following up his story, if hard evidence including actual trail samples can be obtained, it seems this is one trail that isn’t going to go cold in a hurry.
2.13.2 Derby Telegraph (Andrew Johnson)

If an accurate view of the causes of climate change is to be obtained, it must be properly recognised that ALL planets (with an atmosphere) in the solar system seem to be undergoing change. Basic, referenced data is presented in this section and, once again, this should be carefully reviewed and not ignored. It can be seen that in the last 30 years, significant changes (i.e. not specifically “warming” alone) have been observed and recorded in ALL planets of the solar system. The significance of this should be obvious. A paper/article by Wm. Robert Johnston provides some additional comparisons to the ones shown below[19].
3.1 Venus – Changes in Composition of Atmosphere
"Our model shows Venus has changed dynamically in the recent past," said Bullock. "Since Venus and Earth have a number of similarities, there are implications here for our own future." An article by Bullock and Grinspoon regarding global change on Venus appears in the March issue of Scientific American.[20]
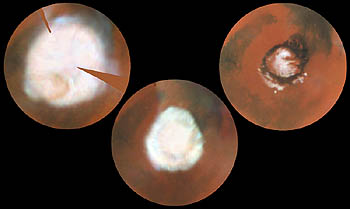
3.2 Mars – Polar Ice and Hexagon Shape?
|
|
“Particularly evident is the marked hexagonal shape of the polar cap at this season, noted previously by HST in 1995 and Mariner 9 in 1972; this may be due to topography, which isn’t well known, or to wave structure in the circulation. This map was assembled from WFPC2 images obtained between Dec. 30, 1996 and Jan. 4, 1997.”[21] |
3.3 Jupiter
3.3.1 April 2004 – Researcher predicts global climate change on Jupiter as giant planet’s spots disappear.
“According to Marcus, the imminent changes signal the end of Jupiter’s current 70-year climate cycle. His surprising predictions are published in the April 22 issue of the journal Nature.”[22]
3.3.2 March 2006 – Jupiter’s New Red Spot[23]

3.3.3 2008 Jupiter gets a brand-new Red Spot[24]

3.3.4 2010 – Big Mystery: Jupiter Loses a Stripe[25]

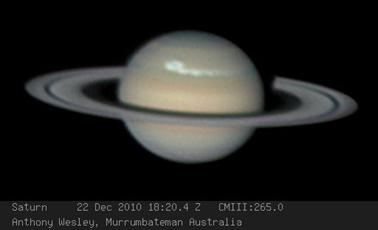
3.4 Saturn: “Saturn’s rotation puts astronomers in a spin”
|
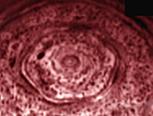
The most commonly cited figure for Saturn’s rotation period – 10 hours, 39 minutes and 22.4 seconds – was derived in 1980 from Voyager observations of radio waves generated by solar radiation hitting the planet’s atmosphere. Yet Cassini has returned a result almost 8 minutes longer, a difference that defies easy explanation.[26] 3.4.1 Saturn’s Polar HexagonWhat if there are “resonance wave” effects in the atmosphere creating centres of warming or cooling?[27] This could be what is happening on Saturn.[28]
|
|
3.4.2 Huge Storm on Saturn – 29 December 2010 [29]
3.5 Uranus
3.5.1 Huge storms hit the planet Uranus[31]

Infrared images from the Hubble Space Telescope reveal dramatic storm clouds moving in excess of 500 km/hr.
Early visual observers reported Jupiter-like cloud belts on the planet, but when NASA’s Voyager 2 flew by in 1986, Uranus appeared as featureless as a cue ball. In the past 13 years, the planet has moved far enough along its orbit for the sun to shine at mid- latitudes in the Northern Hemisphere. By the year 2007, the sun will be shining directly over Uranus’ equator.[32]
3.5.2 Bright Cloud in 2005 [33]

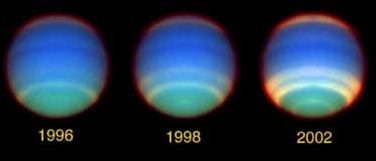
3.6 Neptune – “Seasonal Changes”?
|
|
Seasons on Neptune occur for the same reasons as on Earth. The seasonal changes on both planets occur because their axes tilt slightly. Earth is inclined 23.5 degrees. Neptune is tipped at an even greater angle: 29 degrees. As both planets travel around the Sun, their southern and northern hemispheres are alternately tipped toward or away from the Sun.[34]
But is this really correct? The time period covered is 6 years. However, Neptune’s orbital period is 165 years – ¼ of this would be approximately 41 years…
|
|
|
Caption: A time series of images of the planet Neptune taken by the Hubble Space Telescope illustrate increasing cloudiness that is a hallmark of seasonal change. The growing bands of clouds in the southern hemisphere of the planet suggest seasonal change. Because the planet takes about 165 years to orbit the sun, the seasons on Neptune last more than 40 years.[35]
So, a season lasts 6 years – or 40 years? |
|
|
3.7 Pluto: Pluto is undergoing global warming, researchers find
Pluto is undergoing global warming, as evidenced by a three-fold increase in the planet’s atmospheric pressure during the past 14 years, a team of astronomers from Massachusetts Institute of Technology (MIT), Williams College, the University of Hawaii, Lowell Observatory and Cornell University announced in a press conference today at the annual meeting of the American Astronomical Society’s (AAS) Division for Planetary Sciences in Birmingham, AL.[36]
3.8 Possible Mechanism Behind these Changes?
Some have proposed that a “different physics” is behind these planetary changes. Perhaps this physics could explain the following facts (check them):
- Olympus Mons, 27km high volcano on Mars – latitude 19 degrees
- Solar Maximum – most sunspots occur at latitudes of 19.5 degrees
- Red Spot on Jupiter 19.5 degrees.
- Big Island of Hawaii – latitude 19 degrees
- Dark spot on Neptune – latitude 19 degrees
- Alpha & Beta Regio – Venusian volcanoes – latitude – 19.5 degrees.
- Strongest El Nino currents occur on latitude – 19 degrees.
What if some “wider scale” energy system is causing all these changes (including the Sun’s unusual activity in the last 10 years[37])?
3.9 Local Interstellar Medium
This could also be affecting the global climate[38].
Research on the properties of the Local Interstellar medium have been carried out in scattered periods beginning in 1978. The NASA Space Physics Division has shown a persistent pernicious bias against work on the effects of the neutral gas in the LISM in the United States, from the time of the formation of the Division. The dominant role of neutral hydrogen in the formation of the termination shock in the collision of the solar wind with the LISM has only recently been recognized by the particles and fields research community, which has been supported primarily by the Space Science Division. The most important contributions to research in this program are papers (48), which presents a calibration independent method of determining absolute LISM density, and (89), which presents the first evidence for a large increase in the LISM neutral atomic hydrogen density from Voyager measurements of the 50 AU region, suggesting the approach to the termination shock (89). See 19, 20, 21, 48, 64, 82, 89.
3.10 An Electrically Charged Solar System/Universe?
Some researchers such as Prof Jim McCanney propose that some of changes in the solar system take place because of changes in the electrical activity of the sun[39]. Conventional science contends the solar system is electrically neutral. David Talbot and Wallace Thornhill also provide evidence of an overall “shaping of the universe” by the electric fields associated with matter, and not the force of gravity[40]. They, too, do not believe in AGW theories[41].
4.1 Solar Activity
4.1.1 The Maunder Minimum
It is far too often that the enormity of the sun is overlooked. For example, a 1976 paper concludes there probably was a link between sunspot activity and “the little ice age”.
In a paper entitled “The Maunder Minimum” by John Eddy[42], the conclusions note
The coincidence of Maunder’s "prolonged solar minimum" with the coldest excursion of the "Little Ice Age" has been noted by many who have looked at the possible relations between the sun and terrestrial climate (73). A lasting tree-ring anomaly which spans the same period has been cited as evidence of a concurrent drought in the American Southwest (68, 74).
The paper goes into quite some detail.
4.1.2 Jasper Kirby and Solar Activity
He was lambasted in 1998 for stating:
that the sun and cosmic rays "will probably be able to account for somewhere between a half and the whole of the increase in the Earth’s temperature that we have seen in the last century." [43]
He was involved in work at CERN with regard to the effects of cosmic rays and cloud formation[44].
4.2 The Medieval Warming Period (MWP)
This is generally disliked by the anthropogenic climate catastrophists – who have a lot of evidence to argue with – when many diverse records show that the period between about 1000 to 1300 was as warm in many parts of the world as it is now[45]. Clearly, this warming cannot be blamed on industrialization!
Lord Monckton has written about this in some detail, as well as the contested “Hockey Stick” graph[46].
5.1 Radar Anomalies
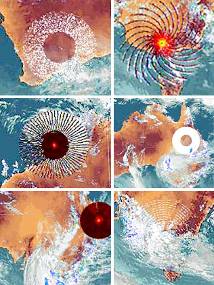
5.1.1 Australia
|
|
The anomalies first began on January 15 when an "iced doughnut" appeared over Kalgoorlie in WA.
Satellite imagery showed there was no cloud over the area at the time to explain the unusual phenomenon but farmers’ online comments claimed it was "unusually hot" all day.
It was followed by a bizarre red star over Broome on January 22 and a sinister spiral burst over Melbourne described by amateur radar buffs as the Ring Of Fire Fault.[47] |
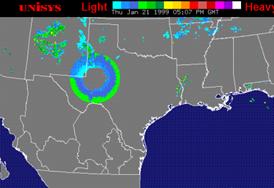
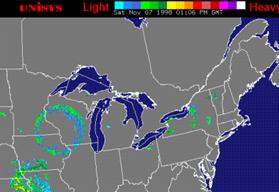
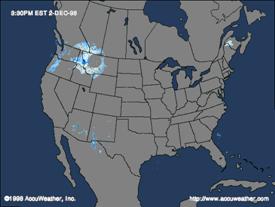
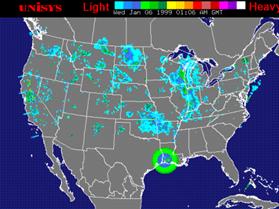
5.1.2 USA[48]
|
|
|
|
|
|
5.1.3 UK – Infra Red Photo Weather Anomalies – 10 Sep 2010, Met Office
Note criss-cross lines – west of Bay of Biscay (bottom left of photo) – original source now archived[49]. This criss/cross pattern appeared between 0400 and 1600 hours.
|
|
|
|
 ,
,
This can also be seen in a video of frames[50].
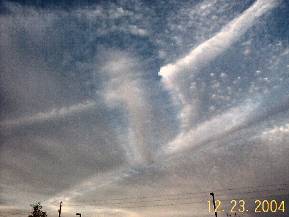
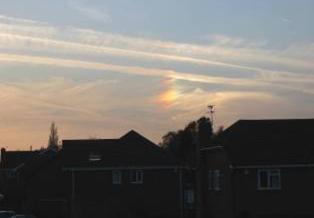
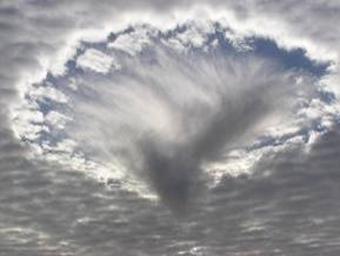
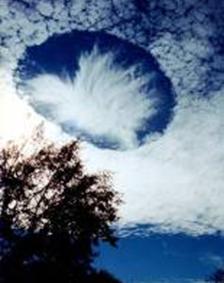
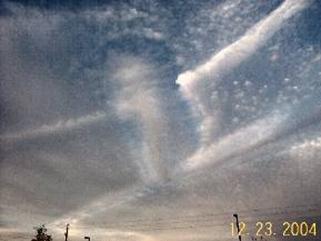
5.2 Weather Anomaly Photos from the Ground (Many more available)
|
This image was taken the morning of Nov 17, 2004 from a plane departing New York’s JFK airport.[51] |
2004-‘Hole in sky’ amazes scientists – Alabama[52]
|
|
Battle Creek Michigan 21 September – 2004 Nearing sunset[53] |
|
|
2004 – Orlando Florida late in the day prior to Christmas Eve. Blooming “contrails” evident with a striking oval imprint deposited into the cloud field. |
June 7, 20040108Z Southern – Montana/East Idaho/NW Montana Note Square Cloud[54] . |

5.3 Hurricane Erin on 9/11
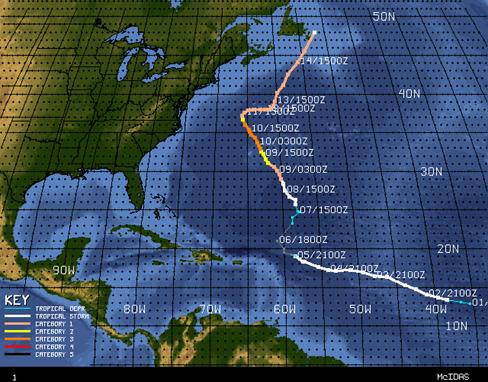
The research of Dr Judy Wood, former professor of Mechanical Engineering at Clemson University (South Carolina), into the destruction of the World Trade Centre, lead her to post a collection of data about Hurricane Erin[55]. Few people are aware that this category 3 storm, comparable in diameter to Hurricane Katrina, was closest to New York City at about 8am on the morning of 9/11/2001[56]. In the morning weather reports, only 2 out of 4 local news channels reported the presence of the Hurricane[57]– even though it had been moving, in a fairly straight line, towards New York City since its encounter with Bermuda on 7th Sep 2001[58]. (This is noteworthy because storm swells would have posed a risk of flooding – potentially to New York’s subway system, had the hurricane remained where it was on 9/11/01. Oddly, on 12 Sep 2001, the Hurricane made a right hand turn and moved off east, towards Newfoundland.)
Understanding the possible reason for the presence of this hurricane is difficult – as one has to re-analyse, at a fundamental level, the official story of 9/11 – especially in relation to the way the WTC complex was destroyed. This has been the subject of most of the rest of Dr Judy Wood’s analysis of 9/11 data and evidence, which resulted in her submitting a “qui tam” case for science fraud[59] against some of the contractors whom NIST employed to contribute to the 10,000 pages of reports entitled “The Collapse of the World Trade Centre Towers”.
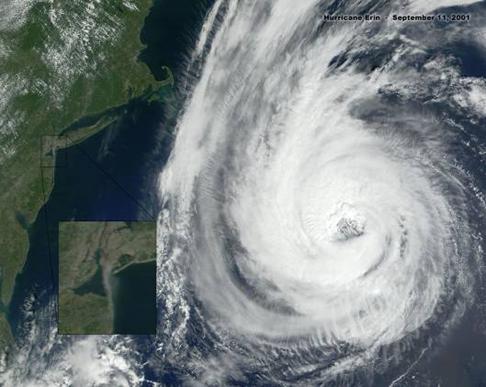
The enlarged section shows the plume of material rising from the destroyed WTC complex.
5.4 The HAARP project and Ionospheric Heaters
This is the High Frequency Active Auroral Research Program[60]. The programme is described as “… a scientific endeavor aimed at studying the properties and behavior of the ionosphere, with particular emphasis on being able to understand and use it to enhance communications and surveillance systems for both civilian and defense purposes.” The site that the HAARP facility is built on is owned by the US Department of Defence and a “2.5 MW diesel generator [which] will be used to power the HF transmitters.[61]”
HAARP is that is a very large project, whose purpose is to “inject” large quantities of energy into the atmosphere.. It is interesting to note, however, “The first HAARP research experiment was conducted in cooperation with the NASA WIND Satellite on November 16-17, 1996. The first comprehensive research campaign was conducted during early March 1997.”[62] . These dates seem to match quite well with the time when the persistent aircraft trails started to become more widespread and prevalent.
Bernard Eastlund’s patent[63], on which HAARP is based should be studied, bearing in mind several similar facilities are already in operation. (With at least HAARP in Alaska and EISCAT in Norway[64])
6.1 Investment in Energy Alternatives
The real problems are much, much different – and deeper and wider – than those assumed to be caused by CO2 emissions (or any other emissions for that matter). Traditional renewable alternatives such as wind turbines, solar heating, solar photovoltaic systems and geothermal energy systems are being utilised more – as some technologies that are publicly available become cheaper and/or more robust, but all these systems have limitations because of things like energy storage and maximum energy output for a given situation (e.g. solar PV is much less useful in northern latitudes).
It is now time for a fundamental change in thinking and a realization of “how things really are”. From other research, it becomes clear than much less polluting – even non-polluting – and perhaps limitless energy sources have been perniciously (and fatally) suppressed.
6.2 Cold Fusion – Killed off by Vested Energy Interests
- Examine Cold Fusion of Research[65]
- Cold Fusion Champion Murdered[66]
- Fire From Water Documentary Interviewing Scientists who worked on Cold Fusion Experiments[67].
6.3 “Salter’s Duck” – Killed off in the 1980’s
Salter has drawn some attention with his “cloud maker” idea[68]. However, he does not seem to talk about his “duck” device which could have produced large quantities of energy and was reviewed independently and funding was recommended. It was then withdrawn without the agreement of the independent reviewer[69],[70],[71].
6.4 Meyer Cell – Efficient Water Splitter – Emission-less Car
Stanley Meyer developed this extremely efficient (unconventional) electrolyser – and was eventually poisoned at a meeting with investors[72].
6.5 Safe Hydride Storage System for Hydrogen Car – Illegal
Bob Lazar’s ingenious system is deemed illegal because of the Hydride it uses – a safe material, but it is a “weapons grade material” and so cannot be sold[73].
6.6 Other Energy Issues
The cases mentioned briefly here are mentioned in more detail in a 2-hour presentation (by the author) available online[74],[75].
It is sadly inevitable that including this section does play into the hands of the control group, as it is likely to perpetuate elements of the “bickering and squabbling” and therefore be part of the process described in section 1.3 and take away attention from the important data covered in sections 2 and 5.
7.1 Critics of AGW
- Dr David Bellamy – who suddenly didn’t get any more phone calls from the BBC when he started to point out the flaws in the AGW science[76].
- Dr Tim Ball (University of Winnipeg)[77]
- Harold Lewis is Emeritus Professor of Physics, University of California has recently said “global warming is the greatest and most successful pseudoscientific fraud I have seen in my long life” and “I think it is the money, exactly what Eisenhower warned about a half-century ago. There are indeed trillions of dollars involved, to say nothing of the fame and glory (and frequent trips to exotic islands) that go with being a member of the club”.[78]
- Newscaster Peter Sissons criticised the BBC for failing to be more skeptical about AGW[79].
- Chris Landsea (Resigned from IPCC) – who have now admitted some data they used came from a mountaineering magazine article and a student’s dissertation[80].
7.2 “Climategate” (Hadley CRU) – Admitted Science Fraud
This did receive some small media coverage earlier in 2010, but due to the significance of the data revealed, it was not proportionate. The whole set of e-mails “leaked” just before the Copenhagen Summit in 2009, can be downloaded[81] and perhaps the timing of the “leak” is part of the general strategy described in section 1.3.
7.2.1 Manipulation of evidence:
I’ve just completed Mike’s Nature trick of adding in the real temps to each series for the last 20 years (ie from 1981 onwards) amd from 1961 for Keith’s to hide the decline.
Notice the use of the words "trick" and "hide" – this seems to betray an agenda which is not one of establishing the truth. An agenda of honest inquiry would foster a comment like "we should re-check our models – maybe they are not correct" rather then "how can we massage the evidence so that our models still look good?"
7.2.2 Private doubts about whether the world really is heating up:
The fact is that we can’t account for the lack of warming at the moment and it is a travesty that we can’t. The CERES data published in the August BAMS 09 supplement on 2008 shows there should be even more warming: but the data are surely wrong. Our observing system is inadequate.
7.2.3 Suppression of evidence:
Can you delete any emails you may have had with Keith re AR4? Keith will do likewise. He’s not in at the moment – minor family crisis. Can you also email Gene and get him to do the same? I don’t have his new email address. We will be getting Caspar to do likewise.
7.2.4 Fantasies of violence against prominent Climate Sceptic scientists:
Next time I see Pat Michaels at a scientific meeting, I’ll be tempted to beat the crap out of him. Very tempted.
7.2.5 Attempts to disguise the inconvenient truth of the Medieval Warm Period (MWP):
……Phil and I have recently submitted a paper using about a dozen NH records that fit this category, and many of which are available nearly 2K back–I think that trying to adopt a timeframe of 2K, rather than the usual 1K, addresses a good earlier point that Peck made w/ regard to the memo, that it would be nice to try to “contain” the putative “MWP”, even if we don’t yet have a hemispheric mean reconstruction available that far back….
7.3 Many Scientists Do Not Agree with AGW Theory
7.3.1 Breaking: Less Than Half of all Published Scientists Endorse Global Warming Theory
Of 528 total papers on climate change, only 38 (7%) gave an explicit endorsement of the consensus. If one considers "implicit" endorsement (accepting the consensus without explicit statement), the figure rises to 45%. However, while only 32 papers (6%) reject the consensus outright, the largest category (48%) are neutral papers, refusing to either accept or reject the hypothesis. This is no "consensus."[82]
7.3.2 Notes on “Global Warming”
I could not resist including this cartoon[83] (see section 3.3 for a good reference).

7.3.3 Ice In The Greenhouse: Earth May Be Cooling, Not Warming
Indeed, there are signs from some natural systems that global warming is under way. Observations of the pack-ice thickness of the Arctic Ocean from submarines with upward-looking sonar, for example, show a thinning trend since the 1970s. The margin of permafrost is moving north, and the vegetation in the high northern parts of the world is changing toward more temperate forms. But it is by no means clear whether these signs indicate real, worrying proof of manmade, permanent and potentially disastrous climate change, or just regular, naturally occurring variations in the Earth’s climate system.[84]
Jens Bischof is author of Ice Drift, Ocean Circulation And Climate Change and is a research assistant professor in Old Dominion’s Department of Ocean, Earth and Atmospheric Sciences.
7.3.4 100 Scientists tell Obama he is wrong.
"Few challenges facing America and the world are more urgent than combating climate change. The science is beyond dispute and the facts are clear."
— PRESIDENT-ELECT BARACK OBAMA, NOVEMBER 19 , 2008
With all due respect Mr. President, that is not true.
We, the undersigned scientists, maintain that the case for alarm regarding climate change is grossly overstated. Surface temperature changes over the past century have been episodic and modest and there has been no net global warming for over a decade now.1,2 After controlling for population growth and property values, there has been no increase in damages from severe weather-related events.3 The computer models forecasting rapid temperature change abjectly fail to explain recent climate behavior.4 Mr. President, your characterization of the scientific facts regarding climate change and the degree of certainty informing the scientific debate is simply incorrect. [85]
This statement by President Barack Obama serves to illustrate the power of the control group – and the results it can achieve when there is a general and even wilful ignorance of additional and contrary evidence in relation to the issue at hand.
7.3.5 Global Warming Petition Project
This petition was set up by Arthur B. Robinson, BS Caltech, PhD UCSD and Noah E. Robinson, BS SOU, PhD Caltech[86], and is circulated with a summary of peer-reviewed research[87]. The petition has already been signed by over 30,000 scientists.
We urge the United States government to reject the global warming agreement that was written in Kyoto, Japan in December, 1997, and any other similar proposals. The proposed limits on greenhouse gases would harm the environment, hinder the advance of science and technology, and damage the health and welfare of mankind.
There is no convincing scientific evidence that human release of carbon dioxide, methane, or other greenhouse gases is causing or will, in the foreseeable future, cause catastrophic heating of the Earth’s atmosphere and disruption of the Earth’s climate. Moreover, there is substantial scientific evidence that increases in atmospheric carbon dioxide produce many beneficial effects upon the natural plant and animal environments of the Earth.
Study of ALL the data presented in this document leads one to these conclusions.
- Aircraft trails are relevant to localised climate change on some occasions.
- Significant Changes are happening on all other planets in the solar system.
- ENVIRONMENTAL DESTRUCTION and CLIMATE CHANGE have DIFFERENT CAUSES.
- Some agency appears to already have the ability to modify the weather – i.e. steer and/or create hurricanes and generate other effects localised to regions of up to a few hundred miles in size.
- Other research mentioned shows that Pollution Free Energy Technologies (or ones with far lower levels of pollution) have been perniciously suppressed.
- Much wider data considerations must be made if honesty, integrity and credibility are to be retained within the scientific community.
If this document has not made you in some way “angry” then it is hoped it has made you curious to learn more – perhaps, through your curiosity, you can then help to change the world for the better.
