
By Fredrik Nygaard, 28 January 2016, Porto Portugal.
This is a revised version of "The Electric Universe Model of Gravity and the Expanding Earth"
Also see Fredrik’s Websiite: www.universeofpartic…
Introduction
Back in September 2015 I wrote a paper titled "The Electric Universe Model of Gravity and the Expanding Earth" in which I demonstrated that a dipole model of gravity supports the theory of a steam powered expansion of our planet, as postulated by Peter Woodhead in his paper on the subject.
By simple logic I showed that if gravity is a dipole at the atomic level, meaning that it has direction and polarity, it must mean that all stellar bodies, including our planet, our sun and our moon, are hollow.
Having shown this to be the case, I went on to demonstrate that this again would mean that gravity at the surface of our planet would increase with expansion without any matter needing to be added, and I arrived at a formula that yielded a number for this increase in surface gravity that matches the numbers derived from fossil and geological evidence.
However, in arriving at my formula I left out an important consideration related to how matter pulls on an observer, and to remedy this omission I have gone ahead and produced this revised paper.
In this version, much remains unchanged from the original. However, the formula I arrive at is different, treating relative location of matter in a manner more in line with Newton’s original work on gravity.
I have also made some changes to the illustrations and included examples and topics that were bypassed in the first version.
The Expanding Earth
My investigation into dipole gravity as an alternative to the standard point source model, started shortly after I had let myself be impressed by the expanding earth theory, excellently presented by Neil Adams in his YouTube video.
Having found the evidence for expansion presented by Neil Adams convincing, and being further convinced by the work of geologists like James Maxlow, I started looking for a good theory to explain the mechanism behind this expansion. And while doing this I came across Stephen Hurrell’s work on the impossible size of the dinosaurs, in which he suggests that surface gravity must have increased by 300 to 400 per cent since the days these enormous animals roamed the earth.
Surface gravity as we experience it today is simply much too strong to allow for such massive land animals, some of which were even able to fly despite being the size of a car.
So not only do we have convincing evidence for expansion, fossil records suggest that surface gravity has increased as well, and not by a small amount, which in turn suggests that the increase in surface gravity cannot easily be explained by a mechanism in which our planet has grown through an accumulation of matter.
As pointed out by Peter Woodhead in his critique of the mass accumulation theory, simple geometry tells us that surface gravity will increase linearly with a change in radius, provided the added matter is of identical density to the original. So if our planet has grown by a mechanism of matter accumulation, and the added matter has had the same density as the original, our planet would have experienced an increase in surface gravity equal to its increased radius.
In other words, if the original matter was rock, as seems reasonable to believe, the accumulated matter must have had the density of rock in order to produce a current surface gravity 100 per cent greater than at the time of the dinosaurs.
However, Stephen Hurrell’s estimate is for a 300 to 400 per cent increase, so the added matter would have to be much denser than rock for this mechanism to deliver the required increase.
Furthermore, if our planet has become increasingly massive, our moon would have been affected by this. If the 300 to 400 per cent increase that Stephen Hurrell talks about is more than just a local surface increase, but an increase that extends to our planet’s relationship with our moon, then our moon would have been drawn closer to us and possibly even crashed into us. However, from observations we know that our moon is receding from us, which is quite the opposite of what would be expected from a planet that has been accumulating matter for millions of years.
The increased gravity experienced at the surface of our planet does not appear to have affected the moon, so it appears that gravity has increased locally, at and near the surface of our planet, but not at greater distances. Furthermore, it seems extremely unlikely that there exists an as yet undiscovered mechanism in which our planet can absorb or generate extremely massive matter, essentially from nothing.
So I came to the conclusion that surface gravity must have increased by some other mechanism than mass accumulation, and the most appealing mechanism that I came across in my research was a simple model proposed by Peter Woodehad in which our planet has expanded due to internal pressures, primarily from water turning to steam, and that surface gravity has increased due to a process where the heavy stuff of our planet has risen up towards the surface.
The advantages of this theory compared to theories involving an increase in mass are that we do not have to invent a mechanism in which mass is increased or absorbed by our planet, and we do not have to explain why our moon has not crashed into our planet due to the extra gravitational pull caused by the increase in mass.
Woodhead’s suggestion that expansion has happened without matter being added to our planet, implies that the change in gravity experienced at the surface of our planet does not affect the overall gravitational pull of our planet on a distant object such as the sun or the moon.
And with no known mechanism to explain an increase in mass of our planet, Woodhead’s theory comes across as both clean and elegant, requiring nothing new or unknown to explain the change in surface gravity. However, critics soon raised two objections that needed to be addressed.
The first objection was the fact that Peter Woodhead’s theory violates Newton’s Shell Theorem which states that a gravitational body can always be modelled as having all of its mass located at its geometrical centre. An expanding earth with no added mass would therefore result in a reduced surface gravity, regardless of where the heavy stuff of our planet is located.
The second objection was that the pressures presumed to exist at the centre of our planet are so high that it is simply impossible to produce any gases, and it follows that a steam powered expansion cannot happen.
However, both of these objections presume gravity to be a point source at the atomic level, and it was in an e-mail exchange I had with Mr. Woodhead on these issues that it first occurred to me that gravity might in fact be a dipole as suggested by Ralph Sansbury and promoted by Wallace Thornhill through the Electric Universe community.
If, contrary to what is generally assumed, the atomic unit of gravity is a dipole rather than a point source, Newton’s Shell Theorem does not apply, and the pressure at the centre of our planet cannot be presumed to be particularly high.
Newton’s Shell Theorem
An important but frequently overlooked premise for Newton’s Shell Theorem is that every atomic unit involved in the calculation must be a point source acting with equal force in all directions. If this is not the case, the Shell Theorem cannot be used to simplify things.
If the atomic unit of gravitational force is a dipole, the Shell Theorem simply does not apply.
And contrary to the point source model of gravity, a dipole model predicts a hollow planet with no more pressure at its core than that provided by the planet’s internal atmosphere, precisely the situation Peter Woodhead suggests in his theory.
So, at first glance, Peter Woodhead is in complete agreement with the dipole model of gravity, and this prompted me to extend my investigation into this model to see if I could derive a formula to calculate changes in surface gravity for an expanding earth.
The Atomic Model
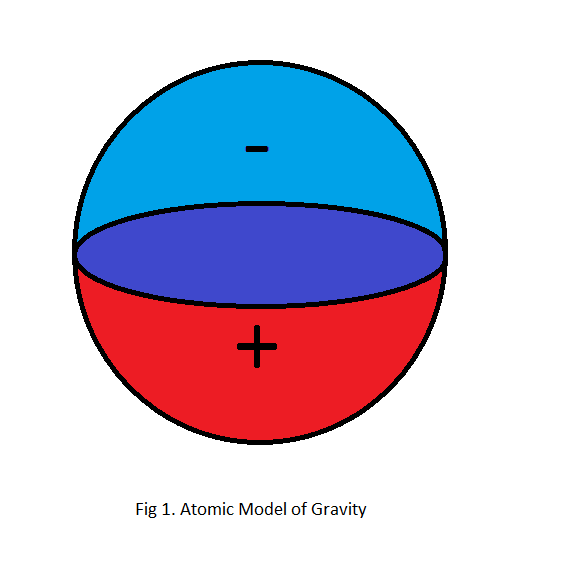
As a first step in my work I considered the atomic unit of gravity and how best to model it.This atomic unit must not be confused with the chemical atom with its protons, neutrons and electrons. Rather, the gravitational atom is about the smallest indivisible unit of gravity, presumably at a level far smaller than the chemical atom.
No one knows exactly where gravity resides at the atomic level, and we are not going to speculate about this here. All we will say is that it must have an atomic level, and that it is a dipole at this level.
And since we know virtually nothing about gravity at the atomic level, we might as well choose as simple a model as possible so that we can both operate on it mathematically without too much effort and add to its complexity if needed. And so we choose the sphere as our atomic model, with one half being positive and the other half being negative as illustrated in fig 1.
Earth as a Gravitational Charged Body
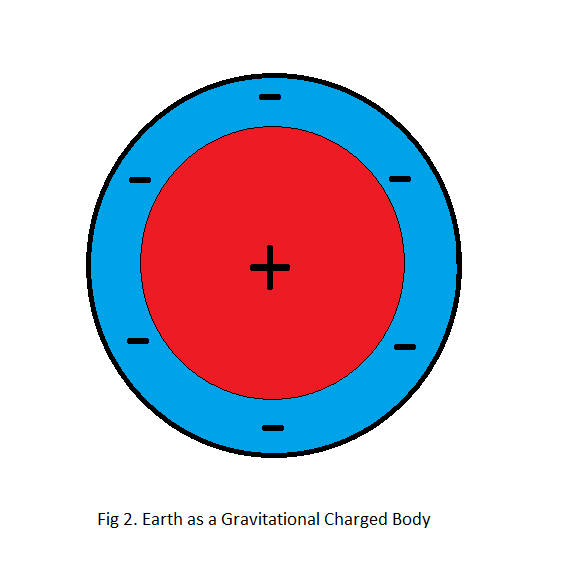
The next step in our analysis is to develop a gravitational model of our entire planet based on our atomic unit, and in doing this we can turn to Wallace Thornhill’s favoured model in which it is suggested that the gravitational atoms line up inside our planet in such a way that their negative poles face up into space and their positive poles face in towards the centre of our planet.
And when we do this we get a planet with a negative surface and a positive centre, as illustrated in fig 2.
My immediate reaction on seeing this model for the first time was that it would result in repulsion rather than attraction between stellar bodies since the surfaces of earth and the moon, for example, would both be negative.
However, as I will demonstrate in an upcoming paper, it does not require a great leap of faith to imagine a mechanism inherent in space that makes stellar bodies attract each other. And this mechanism can be constructed with nothing more than the gravitational atom as it has already been described in this paper.
But for now we will simply say that mutually repelling forces interact much weaker than mutually attracting forces. As a rule, we will say that attraction is much stronger than repulsion. And for simplicity we will say that attraction is so much stronger than repulsion that we can ignore repulsion altogether.
Centre of Gravity, Using the Dipole Model
While the centre of gravity is located at the geometrical centre of our planet, using the standard model, it can be shown that this is not the case for dipole gravity. The dipole model places the centre of gravity at a considerable distance away from the geometrical centre. And it is not really a centre, but a concentric spherical surface where there is equal mass to either side of it, illustrated in fig 2 as a thin line separating the blue area from the red area. However, to avoid new phrases where none are needed, we will nevertheless call it the centre of gravity.
One way of looking at the centre of gravity for a dipole model is to consider an observer moving in towards the geometrical centre of our planet. This observer will at some point reach a place where the overall gravitational pull goes from negative to positive. And at this point the observer will experience weightlessness before again regaining weight on his way towards the geometrical centre. But as the observer continues inwards, he will experience "up" as being in towards the geometrical centre rather than up towards the sky. The observer has to spin around and face the other way when crossing the centre of gravity, as illustrated in fig 3.

Note that the observer will never experience gravity to be repelling since his or her internal dipoles will always be oriented with plus facing towards the geometrical centre of our planet. What changes is the direction that the observer has to exert force in order to move farther in towards the geometrical centre.
The centre of gravity is the place where the overall gravitational pull changes direction, and for any model that does not give the far hemisphere the same weight as the near hemisphere, the centre of gravity must necessarily lay away from the geometrical centre. And since the centre of gravity is located where gravity pulls equally in all direction, the centre of gravity must also be a place of zero net gravitational pull.
So while the standard model predicts zero gravity only at the geometrical centre of our planet, the dipole model predicts zero gravity at the centre of gravity due to gravitational symmetry, and again at the geometrical centre due to geometrical symmetry.
And it follows from this that for the dipole model, a steam powered expansion of our planet will result in the centre of gravity moving out towards the surface. However, since such an expansion will make the non-gaseous shell thinner, it does not necessarily follow that the surface gravity will increase as a consequence.
Surface gravity is not merely a question of where the centre of gravity is located. It is also a question of how thick the non-gaseous shell is, and to what extent the matter involved is oriented towards the observer at the surface.
However, before we go on to locate the centre of gravity and find out what effect this has for surface gravity, we should first address in more detail the second objection to Peter Woodhead’s theory, in which it is claimed that the pressures at the centre of our planet would be too great to allow for steam to be formed.
Internal Pressures
When it comes to liquids turning to gas, it is true that temperature in itself cannot make this happen, and liquids simply do not turn to gas if pressure is above a certain level.
It has been shown that water at a depth of only 2 km beneath the surface of the earth’s crust do not turn into gas at any temperature due to the pressures at this depth, and proposing that the gas inside our planet may be nitrogen, rather than water, does nothing to solve this problem. The pressures at the centre of our planet, according to the standard model, are simply so high that nothing would turn to gas.
However, using the dipole model we get quite a different picture.
What we have to keep in mind for the dipole model is that "down" is always in the direction of the centre of gravity, and this means that "down" is away from the geometrical centre for anything inside the centre of gravity, as illustrated in fig 3.
And since heavy stuff like liquids and solids never exert pressure in any other direction than towards the centre of gravity, a cavity located at the geometrical centre of our planet will experience pressure only from the gases and vapours located inside of it.
An interesting consequence of this is that a cavity, once formed at the centre of our planet, will tend to grow and never shrink. Heavy stuff will be continuously pushing towards the centre of gravity. Any cracks or openings in the inside surface will see heavy stuff like rocks and liquids slip into them while vapours and gasses will rise "up" towards the geometrical centre.
This process will be continuous and erosive, so even if the effect of a cavity at the centre of a young planet may be small, the crust of the planet will sooner or later crack under the relentless pressure, triggering expansion. And once expansion has started it will not stop before the process finally exhausts itself.
Locating the Centre of Gravity, Using Volumes of Spheres
Having dealt with the two main objections to Peter Woodhead’s theory, we can go on to make calculations and predictions based on the dipole model, as it applies to an expanding planet.
To find out where the centre of gravity of our planet is presently located, assuming that our planet has expanded, we can best start by considering where the centre of gravity must have been before the expansion process started.
To do this, we start by making the assumption that our planet was solid all the way through to start with and that the heavy and light stuff was distributed evenly throughout.
From this we get that the centre of gravity must have been located where there was an equal volume of matter on either side of it as illustrated in fig 2.
Letting Vtotal be the total volume of the pre-expansion planet and Vcg be the volume enclosed by its centre of gravity we get:
Vtotal = 2*Vcg
Using the equation for volume of a sphere we get:
(4/3)*pi*Rtotal^3 = 2*(4/3)*pi*Rcg^3
Removing constants on both side of the equation:
Rtotal^3 = 2*Rcg^3
Rtotal^3/Rcg^3 = 2
Rtotal/Rcg = 1.26
So, if the radius of the pre-expansion earth was 3763 km, its centre of gravity was located 776 km below the surface, given a planet that was solid to the core.
Using the same logic, we can find the current location of the centre of gravity by assuming that it must have equal volume of non-gaseous elements on either side of it.
With the earth’s radius today being 6370 km, the non-gaseous shell is only 470 km thick, which has as a consequence that the outer surface of the non-gaseous shell is not very much larger than the inner surface, and it follows that the centre of gravity will be located only marginally closer to the outer surface than the inner surface in order to have equal mass inside and outside of it.
Without doing any calculations, we can estimate the centre of gravity to be currently located at 220 km below the surface, still assuming that pre-expansion earth was solid to the core.
If we on the other hand assume that there was a cavity at the centre of our planet from the very beginning, and that this cavity had a radius half of that of the planet, corresponding to 12.5 per cent of the volume, the location of the centre of gravity would be more like 745 km and 190 km below the surface for the pre-expansion and current expansion respectively.
In other words, using purely geometric considerations, we can conclude that the centre of gravity was located somewhere between 776 km and 745 km below the surface pre-expansion, and that it is currently located somewhere between 220 km and 190 km below the surface.
Horizons and Curvature
Having located the centre of gravity for both the pre-expansion and the current expansion case, we can go on to consider how this change in location has influenced surface gravity.
Based purely on the location of the centre of gravity and the inverse square law, we get a 12 to 15 fold increase in surface gravity. But this completely ignores the fact that much less matter is involved in pulling on the observer at the surface today than was the case during pre-expansion times.
What we need to know in addition to the change in location of the centre of gravity is how large a percentage of the planet was involved in pulling an observer down pre-expansion, relative to what is currently the case.
And to do this, we need to go back and consider the atomic model in fig 1 and the fact that only those atoms that face towards the observer with their negative charge will contribute positively to the gravitational pull. Any atom facing away from the observer must, according to this rule, be ignored.
There is in other words a horizon beyond which an atom will no longer contribute to surface gravity, and the location of that horizon depends on how deep under the surface of our planet the atom in question is located.
The horizon beyond which gravity atoms are facing too much away from the observer to contribute to the gravitational pull is mapped out by the tangents of concentric spheres as seen from the observer at the surface. And these tangents map out a sphere with a diameter identical to the radius of our planet, as illustrated in fig 4.
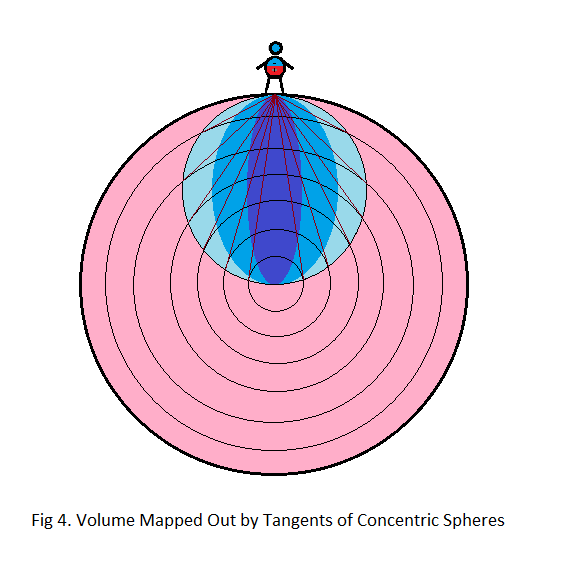
Atoms beyond the tangent face more away from the observer than towards him. Far atoms to either side of the observer point away, as do atoms sufficiently far away from him in any direction. The farther away the atoms are located, the more they point away.
The horizon is the point where an atom as viewed from the observer, is pointing at a right angle with exactly as much negative gravity as positive gravity pointing in his direction. The observer "sees" the atom from its side. Those atoms farther away on the same concentric sphere are "seen" as mostly positive, and those closer are "seen" as mostly negative, as illustrated in fig 5.
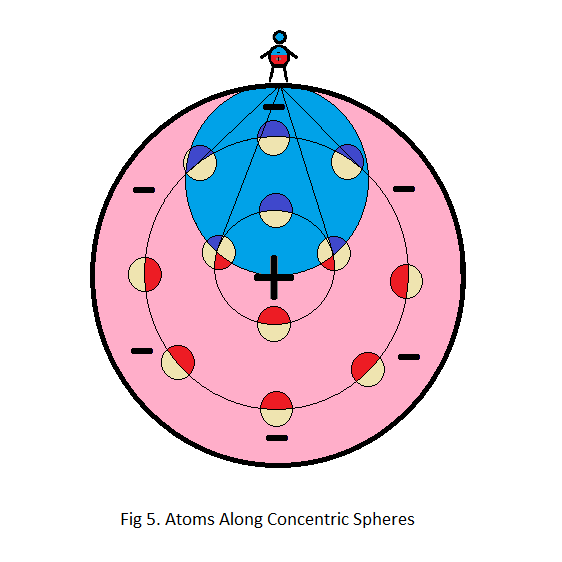
The blue region contains atoms that all point more towards than away from the observer, and the pink region contains atoms that all point more away than towards the observer.
For a dipole model of gravity, only those atoms that are located within the blue sphere mapped out by the tangents of concentric spheres contribute to the gravitational pull on the observer at the surface.
Furthermore, the atoms most directly positioned beneath an observer’s feet, illustrated in fig 4 as a dark blue shaft, are more involved in the attraction than atoms more to the side, illustrated with a lighter blue. Atoms close to the tangents, illustrated with a faint blue, are just barely contributing positively, even if they are relatively close, while atoms directly underneath an observer are contributing significantly even at a considerable distance.
Changes in Mass Distribution for an Expanding Earth
The embedded sphere, mapped out as described above, will always have the same relative volume compared to the larger host sphere. However, as a planet expands, some of the mass that was inside the embedded sphere is pushed out into the region that does not contribute to the gravitational pull on the observer.
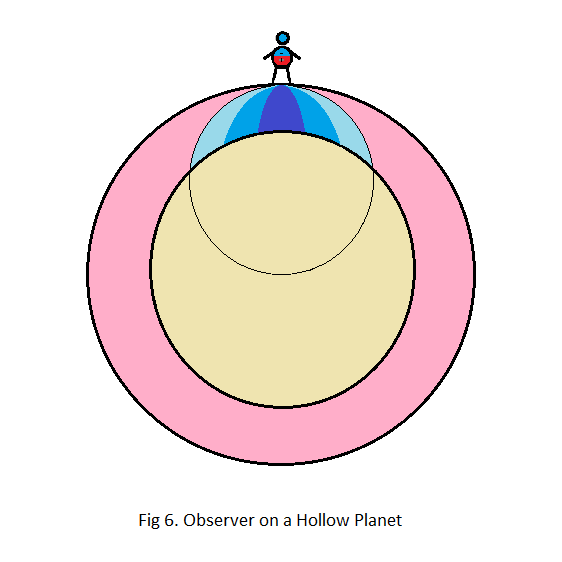
Where fig 4 illustrates a pre-expansion globe, solid to the core, fig 6 illustrates an expanded globe, and we can see by comparing the two pictures that matter that was once inside the embedded sphere appears to have been pushed out of it due to the expansion.
However, to find a numeric value for how much mass in the embedded sphere has been reduce due to expansion we need to do the maths.
For a solid pre-expansion earth with a radius of 3763 km we can use the formula for volume of a sphere:
V = (4/3)*pi*r^3
V = (4/3)*pi*3763^3
V = 223*10^9 km^3
And for the current expansion of our planet where the the radius is 6370 km and the shell is 470 km thick we can use the formula for a spherical cap to get a good estimate of the volume still inside the embedded sphere.
V = (1/3)*pi*h^2*(3*r – h)
V = (1/3)*pi*470^2*(3*6370 – 470)
V = 4.3*10^9 km^3
Dividing the pre-expansion volume by the current volume we get:
223*10^9 km^3/4.3*10^9 km^3 = 52
In other words, the embedded sphere had 52 times more matter in it pre-expansion compared to what it contains now, assuming that our planet was solid to the core before the expansion started.
For the case where there was a cavity of half the radius pre-expansion we get that the initial volume of non-gaseous material contained in the embedded sphere would have been about five eights of what it was in the solid pre-expansion case, or about 139*10^9 km^3.
And the current thickness of the shell would be about 12.5 per cent thinner than for the solid pre-expansion case, or about 420 km, giving us the following calculation for the spherical cap:
V = (1/3)*pi*h^2*(3*r – h)
V = (1/3)*pi*420^2*(3*6370 – 420)
V = 3.5*10^10 km^3
Dividing the pre-expansion volume by the current volume for this case we get:
139*10^9 km^3/3.5*10^9 km^3 = 41
So in this case, where there was a cavity at the heart of our planet from the very start, the mass involved in pulling at an observer at the surface during pre-expansion times was about 41 times greater than is currently the case.
Assuming that the type of matter inside the two embedded volumes are of comparable density, we can conclude that the total mass involved in pulling at an observer on the surface during pre-expansion times was 52 to 41 times more than it currently is.
However, this range of values cannot be used directly in combination with the location of the centre of gravity, since it gives equal weight to matter that is peripheral and matter that is central, illustrated in pale blue and dark blue respectively in fig 4.
As we can see from comparing fig 4 with fig 6, the dark blue shaft in the middle has been reduced in volume, primarily due to a shortening. So while the overall mass has changed by a factor of 52 to 41, the central shaft has only changed by a factor of 8 to 4.
And from the fact that fig 6 represents a planet that is substantially larger, and therefore flatter at the surface, than the one pictured in fig 4 we even have a compensating factor in that the central shaft has become wider.
If we include the fact that this cylinder has grown wider in proportion to the change in surface area of our planet, we get that the base of this cylinder has grown by the square of the change in radius. The central shaft has become wider by a factor of (6370/3763)^2, or 2.9 to be exact.
Taking the increased surface area into account we get that the central cylinder has been reduced in volume, not by a factor of 8 to 4, but by a factor of a mere 2.8 to 1.4, a far cry from the 52 to 41 fold reduction we calculated based on the full embedded sphere.
From this it is clear that we have to find a way to pick a reasonable value from the wide range of values available to us in order to progress, and to do this we have to keep in mind the shape of the concentric shafts making up the volume of the embedded sphere, illustrated with shades of blue in fig 4 and 6.
The concentric shafts are all elliptical, which means that we can model their tips as cones with various arc angles going a few hundred kilometres down. And viewed in this manner it seems reasonable to suggest that a good pick would be a tip with an arc of 60 degrees.
Now, since this tip is in fact the top of an elliptical shaft, the maximum width mapped out by a 60 degrees arc at the surface will prove to be very small compared to the diameter of the full embedded sphere.
And if we model this narrow ellipse as a cylinder with a diameter of about 20 per cent of the embedded sphere, we get that its total volume has grown from 1.7*10^9 km^3 to 8.1*10^9 km^3 due to expansion.
Comparing this range of volumes to the 28*10^9 km^3 to 135*10^9 km^3 contained within the full embedded spheres with their 3763 km and 6370 km diameters respectively, we get that the narrow shaft, mapped out by a 60 degree arc at the surface, is smaller than the full volume by a factor of 17 for both cases.
In other words, the full embedded sphere is about 17 times larger than the cone mapped out by a 60 degree arc, for both pre-expansion and current expansion.
And if we divide the full sphere estimates for mass reduction by 17 we get a drop, not by a factor of 52 to 41, but by 3.0 to 2.5, right in between our two initial estimates for a narrow shaft.
Whichever way we look at this, it appears that a good estimate of how the reduced mass in the embedded sphere has influenced surface gravity lies somewhere between the 8 to 4 and 2.8 to 1.4 range, and we can be fairly sure that any mathematician who decides to look into this and do the integral calculus required to solve this problem in a more formal manner will find the correct values to be in this range too.
The mathematical challenge which we have addressed with arguments and estimates, lies in determining the exact volume of the elliptical shaft in which the dipoles contained within it will exert half the force of the entire embedded sphere.
Although simple to define, this problem is tricky to solve mathematically, and admittedly beyond my capabilities. However, it is quite clear from our analysis that we are talking about a narrow shaft, which means that we are for sure dealing with changes in effective mass in the 8 to 1.4 range.
And seeing that we get a nice wide range, centred in the middle of our other estimates, if we take our lowest range and multiply it by two, we can use this to further narrow down our range.
Multiplying the 2.8 to 1.4 range by two we get a range from 5.6 to 2.8 which we will use for our calculations going forward.
Calculating Changes in Surface Gravity Due to Expansion
Using Newton’s Universal Law of Gravity together with our data we can now write two expressions, one for the pre-expansion and the other one for the current situation.
Starting with the assumption that the planet was solid to the core pre-expansion, we get:
F = G*M1M2/d^2
Fpre = G*5.6*M1now*M2/776^2
Fnow = G*M1now*M2/220^2
Comparing these two gravitational forces we get:
Fnow/Fpre = (G*M1now*M2/220^2)/(G*5.6*M1now*M2/776^2)
Fnow/Fpre = (1/220^2)/(5.6/776^2)
Fnow/Fpre = 2.2
In other words, assuming a pre-expansion planet with no cavity at its core, a dipole model of gravity gives us a 220 per cent increase in surface gravity today since pre-expansion times.
However, if there was an initial cavity with half the radius of the planet we get, using the data we already calculated for this case:
Fnow/Fpre = (1/190^2)/(2.8/745^2)
Fnow/Fpre = 5.5
With a pre-expansion cavity of half the radius, we get a 550 per cent increase in surface gravity today relative to pre-expansion times.
Our results, based on the assumption that we are pulled down by a relatively narrow shaft of mass, give us a change in surface gravity ranging from 220 per cent to 550 per cent. And since this fits very well with Stephen Hurrell’s estimates of a range from 300 to 400 per cent, we can conclude that our assumptions regarding dipole gravity are quite reasonable.
And since the point source model of gravity fails miserably in predicting anything like this, we have through this exercise added to the evidence for gravity as a dipole phenomenon. However, before we draw any final conclusion from this, we first need to see that the dipole model supports other observable facts as well.
But before we search for additional evidence, let us first finish our story about planetary expansion.
What Happens Next
An interesting conclusion we can draw from our above analysis is that there are basically two opposing mechanisms in play for surface gravity, one being the centre of gravity that is moving up towards the surface, and the other being the mass inside the embedded sphere under the observer, which diminishes with expansion.
To start with, the centre of gravity moves up at a rate that outpaces the diminishing mass, and we get an increase in surface gravity. And for a while this increase is quite dramatic. However, when the shell becomes as thin as it is today (fig 6), the mass under the observer is all contained inside a spherical cap that shrinks at an accelerating pace due to the shape of the cap, eventually outpacing the effect of the centre of gravity moving upwards.
When the effect of the shrinking cap starts to outpace the effect of the upward moving centre of gravity, surface gravity will start to fall.
However, the point when this starts to happen is very much dependent on how narrow the central shaft of the cap is. If it is as narrow as we have suggested above, the effect of the shrinking cap will not start outpacing the effect of the upward moving centre of gravity before at a very late stage in the expansion process.
But if the central shaft is wide, we might already have entered this stage.
As it happens, though, there is readily available evidence to suggest that we are still some way away from the point where surface gravity will fall. And the evidence for this can be found in an analysis of known surface gravity anomalies.
Surface Gravity Anomalies
From looking at official gravity anomaly maps of our planet, we find higher than expected gravity readings on mountain peaks as well as relatively low laying areas such as Iceland. And we find lower than expected gravity in high areas, such as on the Tibetan Plateau, but also on lower laying areas such as the Mid West and Brazil.
At first glance, there does not seem to be any sense in this. Standard theory suggests a direct relationship between altitude and gravity, yet there is no such connection as far as the anomalies are concerned.
However, if gravity is stronger for a thin shell than a thick shell, then these anomalies do make sense.
Thin areas such as newly formed cracks and stretched regions can be expected to have relatively stronger gravity than areas that have not cracked or stretched much during the expansion process.
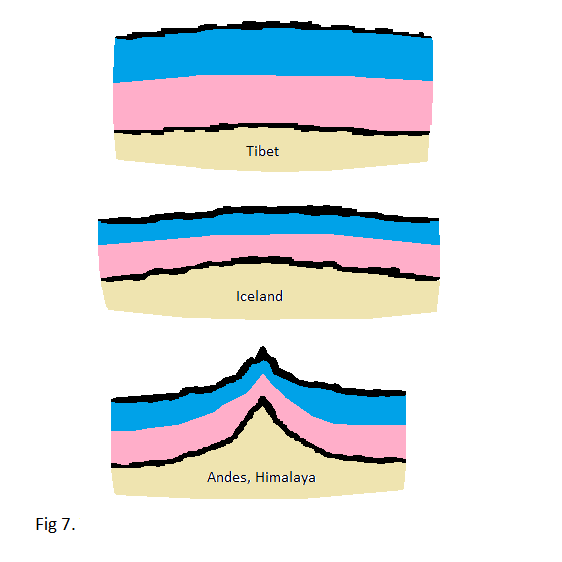
The Tibetan Plateau for instance, which has seen very little geological activity through the ages, is an example of a thick area with a relatively low surface gravity, while a stretched region like Iceland is an example of a thin area with relatively strong surface gravity.
Cracks, which often protrude up, deceptively giving the appearance of being thick, as explained by James Maxlow in his work on the expanding earth, must also be expected to have relatively high gravity readings.
The Andes and Himalaya are examples of cracks. They protrude up on the surface, but there is no corresponding "root" going down, and the overall thickness of the shell in these places is in fact relatively thin.
Other examples of thin, protruding regions are Japan, the entire "Ring of Fire" surrounding the Pacific, the Mid Atlantic rift, and the geologically active ring around the South Pole. And all of these places have relatively strong gravity.
The South Pole on the other hand is a thick and relatively undisturbed slab like the Tibetan Plateau, and has for this reason relatively low gravity.
Old mountains are also cracks, thinner than fairly undisturbed slabs such as the Tibetan Plateau, the South Pole, the Mid West and Brazil, but thicker than newer more geologically active areas. Scandinavia and Iberia are examples of old crack, and can therefore be expected to have surface gravity only slightly on the heavy side. And this is exactly what has been measured to be the case.
What seems at first glance to be a random distribution of gravity anomalies, do in fact follow a simple pattern. Geologically active areas have relatively high gravity while undisturbed areas have relatively low gravity. What matters is not so much the topology of our planet but the thickness of the shell. Gravity is relatively strong where the shell is thin due to geological cracking and stretching, and gravity is relatively weak where the shell is fairly undisturbed and therefore thicker than other places.
From this we can conclude that measured surface anomalies support the dipole model of gravity. And the fact that thin regions have relatively strong surface gravity compared to thicker regions indicates that we are not yet at a point in the expansion process where gravity becomes lower with further expansion. And this in turn supports our estimate for the central shaft of mass acting on us at the surface as being quite narrow and therefore still relatively unaffected by the shrinking spherical cap illustrated in fig 6.
Changes in Gravity with Changes in Altitude
Another conclusion we can draw from our analysis is that observers at different places are pulled down by different parts of our planet, and as seen from the perspective of each observer, gravity is uniformly negative in that it always pulls and never repels.
The observers never experience any effect of matter that is hidden beyond the horizon of the embedded spheres affecting them. The pink region in fig 6 does not affect the observer, and the fact that gravity tapers off at a relatively slow pace with altitude makes it reasonable for observers to assume that they are pulled down by a force that can be modelled as emanating from the centre of our planet, as is the case for the point source model.
However, gravity tapers off in a similarly slow manner for a dipole model, even if the dipole model positions the centre of gravity quite close to the surface. And the reason for this is that there is more matter involved in pulling an observer down at higher altitudes than at the surface.
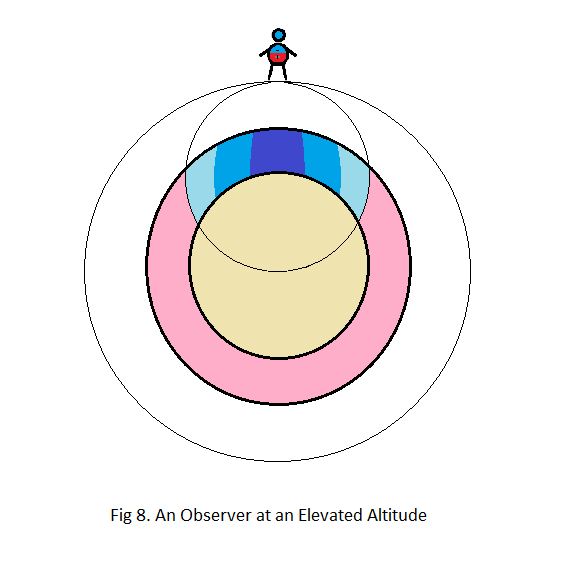
Comparing fig 6 with fig 8, we can see that added altitude results in considerably more of our planet being involved in pulling the observer down, so while the observer’s distance from the centre of gravity has increased at a rate that would suggest a rapid drop in gravity with altitude, based on the inverse square law alone, the added mass greatly compensates for this, making the rate of change in gravity with altitude for a dipole model similar to that of a point source model.
At low altitudes, the difference between the two models will be quite small, and at very high altitudes there will be very little difference too.
However, at altitudes between 100 km and a few earth diameters, the dipole model yields values quite a lot lower than the point source model. At 200 km for instance, the point source model predicts a drop in gravity by about 6 per cent, while the dipole model yields a drop of 25 per cent.
For the point source model, this is calculated based on the inverse square law alone. And with the radius of our planet being 6370 km, the drop in gravity is simply:
Drop = 1 – 6370^2/(6370 + 200)^2
Drop = 0.06
However, for a dipole model, things are a little more complicated.
With the centre of gravity being a mere 200 km below the surface for the dipole model, the drop in gravity at an altitude of 200 km, based solely on the inverse square law, is 75 per cent. However, as already explained, there is more mass pulling on the observer at 200 km than at the surface, and this will greatly moderate the drop.
The way we calculate this added mass is by considering the central shaft, illustrated in dark blue in fig 6 and 8.
Zooming in and overlapping these two figures we get fig 9. And since all of this happens at relatively low altitudes, we can treat the central shaft as a cone as illustrated.
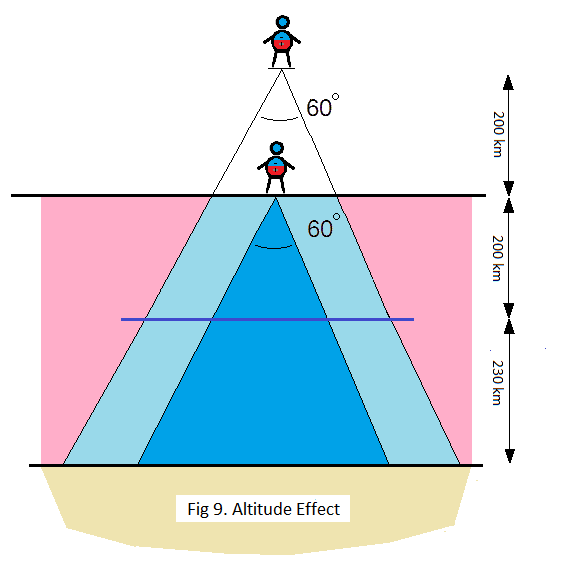
Using the formula for volume of a cone, V = (1/3)*pi*h*r^2, and keeping in mind that for an arc of 60 degrees the radius r is half the hight h, we get that the cone mapped out by an observer at the surface of our planet is 21*10^6 km^3, while for the observer at an altitude of 200 km the cone has a volume of 65*10^6 km^3, including the empty tip.
Subtracting the empty tip, which has a volume of 2*10^6 km^3, from the larger cone, we get a volume of 63*10^6 km^3 pulling on the elevated observer, compared to 21*10^6 km^3 for the observer at the surface.
And that means that the relative mass pulling on the observer at 200 km altitude is pretty much exactly 3 times more than the mass pulling on the observer at the surface.
So while the inverse square law reduces the gravitational pull to a mere quarter of what it is at the surface, the increased mass means that this value has to be multiplied by 3 to get the overall effect of distance and mass.
And we get that the elevated observer experiences a drop in gravitational pull of 25 per cent, which is significantly more than the 6 per cent predicted by the point source model, but without any actual measurements generally available to us for this altitude, we have no way of saying which model is the correct one.
For altitudes lower than 200 km, the dipole and point source models produce results that are closer together, and this is also the case for large distances. However, for all cases the predicted result for the dipole model will yield lower values than the point source model, although quite minuscule at the extremes.
At 10 km for instance, the calculated drop in gravity for a point source is a mere 0.3 per cent, while the dipole model yields a drop in the 2 to 1 per cent range.
Given that we have made several guestimates for our calculations, the error margin for this kind of low altitude calculations are simply too large to say much more for sure than that a dipole model yields a greater drop in gravity than that calculated based on the point source model, and only careful measuring of actual gravity changes with altitude in the intermediate range from about 100 km to a few earth diameters will reveal which model is more accurate. However, such measurements are not generally available, if they exist at all.
What is generally known, though, is that there are a lot of anomalies associated with the point source model, and this goes some way in suggesting that it may not be entirely correct, and that the dipole model may provide a better fit.
Also, having made some measurements myself on a commercial flight between Brussels and Porto, I got readings quite close to 1 per cent at the 10 km cruising altitude. These measurements were admittedly very noisy, but the average was definitely not centred around a mere 0.3 per cent as predicted by the point source model.
Gravity at Greater Distances
At great distances, the dipole model and the point source model become indistinguishable as far as the inverse square law is concerned, and this means that calculations for planetary motion will be identical in respect to this law.
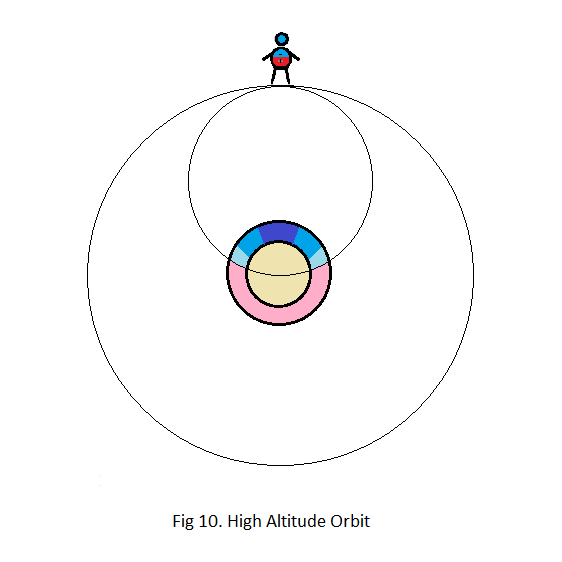
For great distances it does not make a whole lot of difference whether the centre of gravity is located at the geometrical centre of our planet or 200 km below the surface. However, the mass involved in pulling on an observer will never be more than half of the planet’s total inertial mass, as can be seen from fig 10, and this has an important impact on any calculation in which gravitational force is used together with inertial mass.
Estimates of inertial mass based on the assumptions inherent in the point source model will not agree with estimates based on a dipole model. Nor will the estimate of the gravitational constant G.
Furthermore, the fact that the mass involved in gravitational pull varies with distance in such a way that less mass is involved as two bodies near each other, and more mass is involved as they recede from each other, give us slightly more stable orbits than a point source model would predict.
And finally, a very interesting relationship exists between a satellite and an expanding planet which serves to explain the fact that our moon is receding from our planet at a rate that appears to be related to the rate of expansion of our planet.
This curious relationship, pointed out by Keith Hunter in his work, can be explained entirely by the dipole model.
One way to interpret fig 10 is that the amount of mass involved in pulling on an orbiting observer is directly related to the arc of the sky occupied by the central body.
If an observer is in a stable orbit around a planet, the arc occupied by the central body is fixed, and the mass involved in pulling on the observer is also fixed. However, if the central body is expanding, the arc occupied by the central body increases, and the mass involved in pulling on the observer goes down, thus forcing the observer into a wider orbit.
So the reason our moon is receding from us is that our planet is expanding. And the rate of recession is, as suggested by Keith Hunter, proportional to the rate of expansion of our planet.
Conclusion
Having used nothing but simple geometry in our analysis of the dipole model of gravity, we have successfully shown that Peter Woodhead’s theory regarding an expanding earth holds against objections related to Newton’s Shell theorem as well as objections related to presumed pressures at the centre of our planet.
Furthermore, we have shown that the change in surface gravity due to expansion has been somewhere in the 220 per cent to 550 per cent range, and that the way gravity tapers off with altitude can be explained by the exact same formula used to explain the changes in surface gravity due to expansion.
The dipole model of gravity, combined with the theory of planetary expansion, can also be used to explain the fact that our moon is receding from our planet, and why gravity is relatively low at places with low geological activity compared to geologically more active regions.
Useful Links
Peter Woodhead’s theory of a mechanism for an expanding earth:
Peter Woodhead’s critique of the added mass theory:
Keith Hunter’s thoughts and calculations regarding an expanding earth:
Wallace Thornhill presenting Ralph Sansbury’s dipole gravity model:
Neil Adam’s expanding earth:
James Maxlow’s expanding earth:
Stephen Hurrell’s book on dinosaurs:
Official gravity anomaly map: